Have you ever wondered why integration and differentiation are often described as inverse operations? The Fundamental Theorem of Calculus reveals the connection between them. It links two major branches of calculus: integral calculus and differential calculus. In this interactive learning activity, you’ll investigate this connection and build your understanding step by step. Ready to explore? Let’s go!
Modeling Area
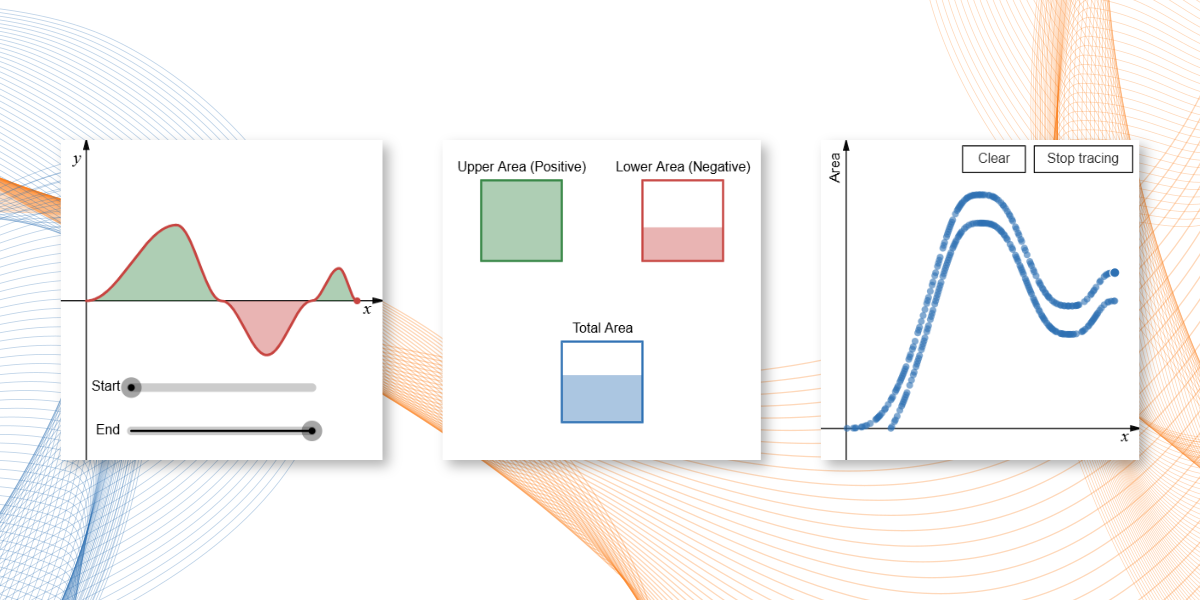
In Visualization 1-1, you’ll investigate the area between the graph of a function and the x-axis. Start by setting the left endpoint (Start), then move the right endpoint (End) back and forth. As you do, pay close attention to what happens in Visualizations 1-2 and 1-3.
Use the questions below to guide your exploration.
- In Visualization 1-2, what do Upper Area (Positive), Lower Area (Negative), and Total Area represent? How do you think these three quantities are related?
- In Visualization 1-3, the y-coordinate of the blue point represents the Total Area shown in Visualization 1-2. Its x-coordinate matches the x-coordinate of the red point in Visualization 1-1. As you move the End slider in Visualization 1-1, how does the blue point move?
- What might it mean when the blue point moves upward and to the right?
- What might it mean when the blue point moves downward and to the right?
- In Visualization 1-3, click the “Trace” button to leave a trail showing the blue point’s movement. Then continue adjusting the End slider in Visualization 1-1. What patterns do you notice in the trail? What story might those patterns be telling?
Making Sense of Rates of Change
Let’s explore the rate of change of area in Visualization 2-1 and the rate of change of a function’s value in Visualization 2-2.
As you explore, use the questions below to help guide your thinking.
- In Visualization 2-1, choose a partition size: Large, Medium, or Small, and move the End slider. What do you notice? What do you wonder?
- What does the slope of the secant line in Visualization 2-2 represent? (If you can’t see it yet, try moving the End slider.)
- What does a positive slope tell you? Why are some secant lines steeper than others?
- What does a negative slope tell you?
- Alex shares this observation: “The size of the secant line’s slope seems to be related to the value of the function shown by the red graph in Visualization 2-1. This relationship becomes especially clear when the Small partition is selected.” Do you agree with Alex? Why or why not?
Connecting Two Graphs
Move the black point in Visualization 3-1 and see what happens!
As you explore these two graphs, think about the following question:
Why does the slope of the tangent line in Visualization 3-1 always match the value of the function shown by the red graph in Visualization 3-2, no matter which value of x you choose?
What's next? To see how the functions you've explored here can be used to model real-world situations, continue to Connecting Distance and Speed.