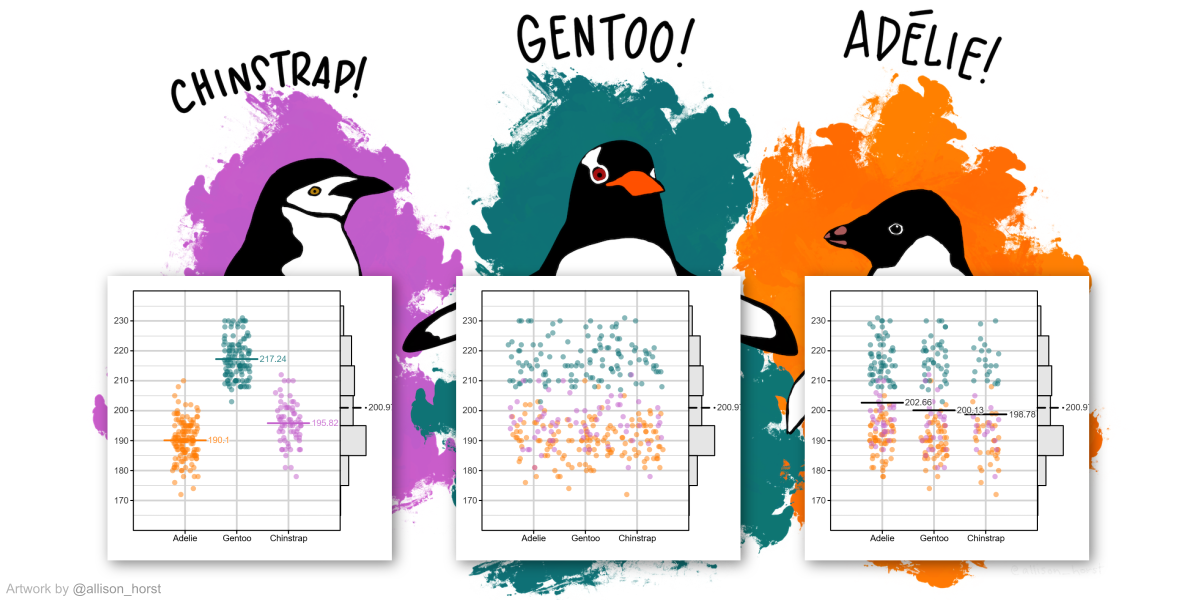
Three penguin species, i.e., Adelie, Gentoo, and Chinstrap, have different flipper lengths. But are the differences we observe in the data actually related to species, or could they have occurred simply by chance? In this interactive simulation, you will investigate this question and discover the key idea behind ANOVA.
Could the Differences Be Due to Chance?
Let’s imagine that species and flipper length are independent. What kind of data might we expect to see? Click “Group”, then click “Shuffle” repeatedly.
Note: Just as the mean (x̄) summarizes the center of a dataset with a single value, the F statistic also summarizes a dataset with a single value. The difference is that the F statistic measures how clearly the groups are separated within the data.
Now look at Visualization 3, which shows the distribution of F values obtained under the assumption that species has no effect on flipper length.
Based on this distribution of F values, do you think the differences in flipper length observed in Visualization 1 (F ≈ 567.41) can be explained by chance alone? Or is there a more plausible explanation?