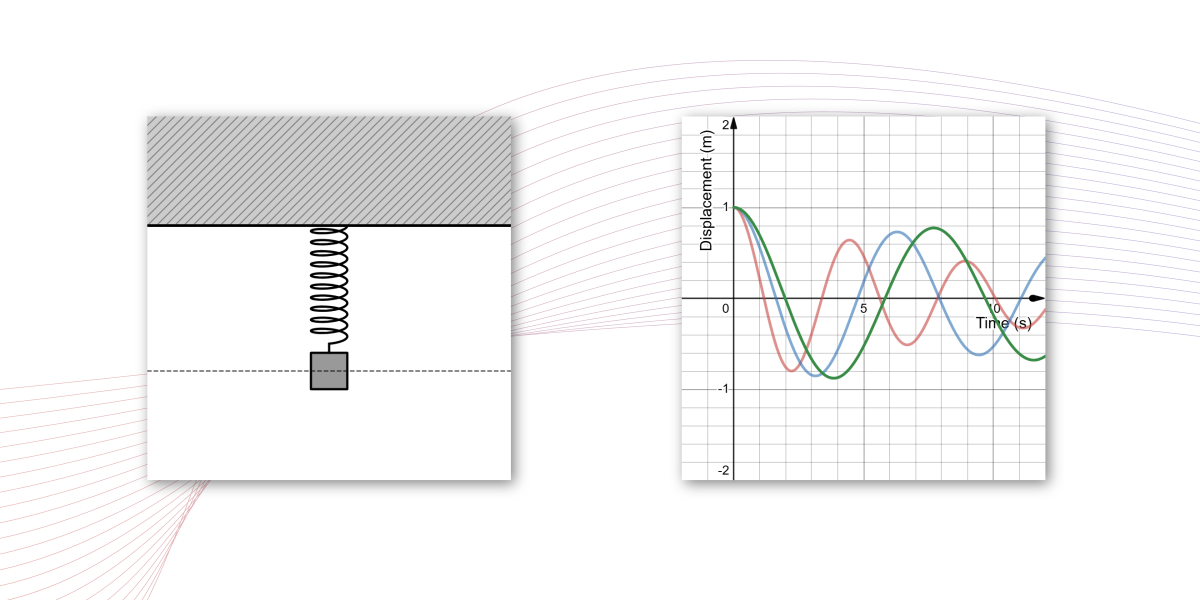
A spring can move back and forth when a mass is attached to it and pulled away from its resting position. But what determines how the mass moves, and how does changing the conditions affect its motion? In this interactive resource, you can experiment with a spring-mass system by changing different settings and observing what happens. You can watch the motion unfold and see how it is represented over time, then capture and compare your observations from different settings. Through these explorations, you can look for patterns and develop your own ideas about how different factors influence the motion.
Seeing Springs in Motion through Graphs
Adjust the spring constant, mass, damping, and initial position. Play the animation and see how the spring’s motion is represented in its displacement-time graph.
In Visualization 2, use “Capture” to save the current graph. You can use it to compare two or more graphs produced with different settings. Use “Clear” to remove all captured graphs. You can also adjust the horizontal-axis bounds by dragging the black point on the right side of the axis to the left or right.
Ready for More?
Above, you explored how the graph of the mass’s vertical displacement over time changes under different settings. But there is more to explore! You can also investigate relationships between other quantities in the spring-mass system. Use the graphing calculator in Visualization 3 to explore relationships between quantities of your choice. Enter values for the quantities you want to investigate in the table, and then look for patterns in the resulting graph.
As a starting point, investigate the relationship between mass and period for undamped oscillations (that is, when the damping coefficient is 0). Here, the period is the time required for the mass to complete one full cycle of its oscillation.
What pattern do you notice? How does the period change as the mass increases? Can you use the graph to describe or predict this relationship?
Next, explore damped oscillations. Set the damping coefficient to a value greater than 0 and investigate how the amplitude of the oscillation changes over time. Here, the amplitude is the maximum displacement of the mass from its equilibrium position.
What pattern do you notice? Does the amplitude decrease at a constant rate, or does the rate of decrease change over time?