Random experiments have unpredictable outcomes. But what happens if the same random experiment is repeated over and over again? Will the results continue to appear random, or will a pattern begin to emerge? In this activity, you will investigate these questions through a series of repeated random experiments.
Keeping Track of Relative Frequency
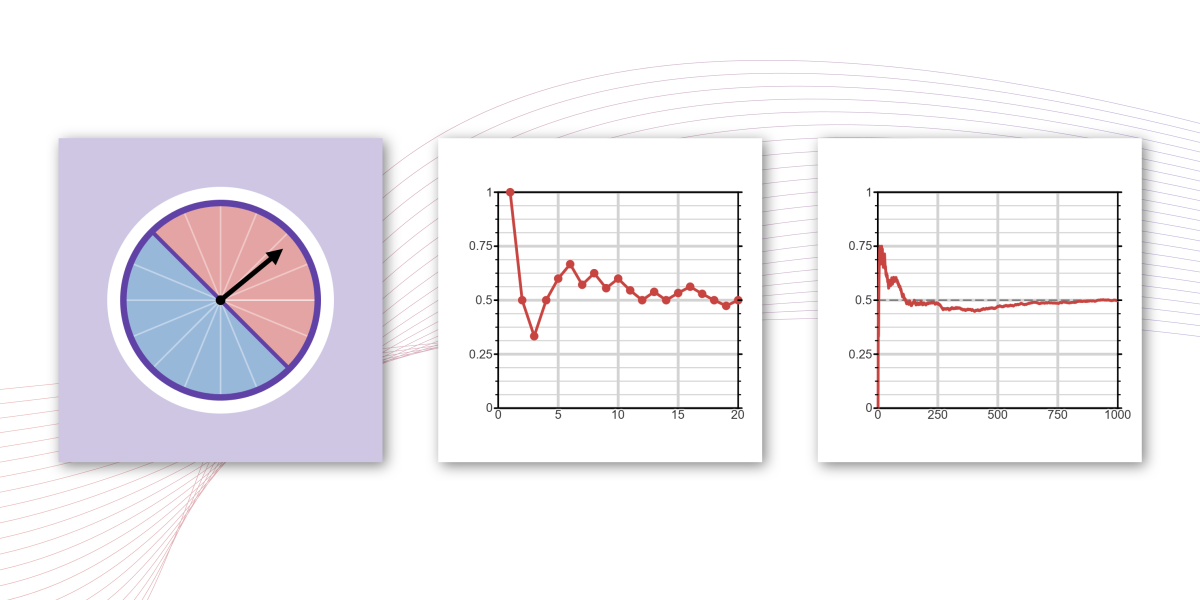
How likely do you think the spinner is to land on the red sector? Click “Spin” then click “Plot” several times to calculate and track the relative frequency.
After repeating the experiment several times, do you notice any patterns?
Continue your investigation by adding 100 more spins at a time in Visualization 3. Observe how the relative frequency changes as the number of spins increases.
Based on the trend shown in Visualization 3, what conclusion can you draw?
What's next? Ready to put your new ideas to the test? Continue to Uncover the Mystery of the Spinner and see if you can solve the mystery!